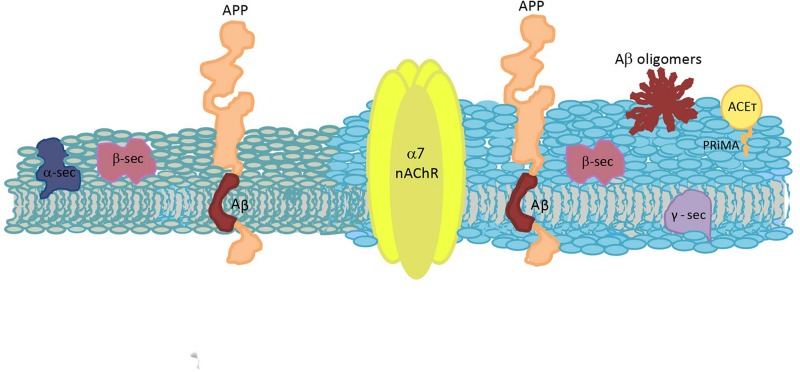
FIGURE 3Figure 3
Schematic diagram of a plasma membrane, depicting the spatial relationship between the molecules involved in Aβ synthesis and the cholinergic system. Two different colors are used to represent a raft domain and a liquid-disordered domain (light blue and gray, respectively). APP, amyloid precursor protein; Aβ, amyloid β peptide; α7 nAChR, α7 nicotinic acetylcholine receptor; ACE T , tetrameric acetylcholinesterase; α-sec, α-secretase; β-sec, β-secretase; γ-sec, γ-secretase; and PRiMA, proline-rich membrane anchor.