🖼
FIGURE 3: Schematic diagram of a plasma membrane, depicting the spatial relationship betwe...
active
paper figure
Created: 2026-04-10T21:37:51
By: paper_figures_pipeline
Quality:
20%
🔗 External
ID: paper-fig-31379503-3
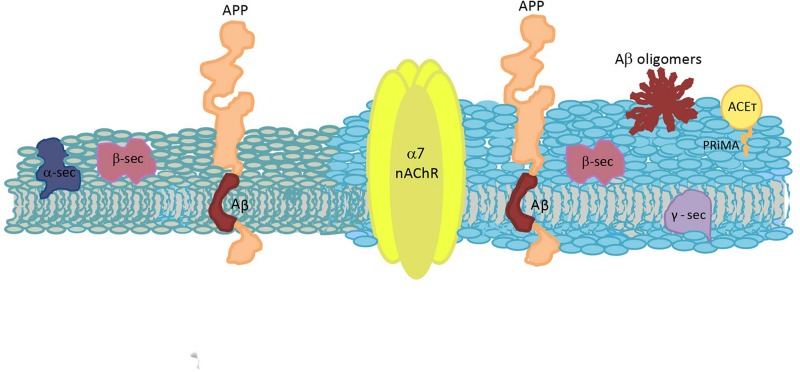
FIGURE 3Figure 3
Schematic diagram of a plasma membrane, depicting the spatial relationship between the molecules involved in Aβ synthesis and the cholinergic system. Two different colors are used to represent a raft domain and a liquid-disordered domain (light blue and gray, respectively). APP, amyloid precursor protein; Aβ, amyloid β peptide; α7 nAChR, α7 nicotinic acetylcholine receptor; ACE T , tetrameric acetylcholinesterase; α-sec, α-secretase; β-sec, β-secretase; γ-sec, γ-secretase; and PRiMA, proline-rich membrane anchor.
▸Metadata
| doi | |
| pmid | 31379503 |
| pmcid | PMC6657435 |
| _origin | {'url': 'https://www.ebi.ac.uk/europepmc/articles/PMC6657435/bin/fncel-13-00309-g003.jpg', 'type': 'external', 'tracked_at': '2026-04-10T21:37:51.541227'} |
| caption | Schematic diagram of a plasma membrane, depicting the spatial relationship between the molecules involved in Aβ synthesis and the cholinergic system. Two different colors are used to represent a raft |
| image_url | https://www.ebi.ac.uk/europepmc/articles/PMC6657435/bin/fncel-13-00309-g003.jpg |
| image_path | |
| description | |
| figure_label | FIGURE 3 |
| figure_number | 3 |
| _schema_version | 1 |
| source_strategy | pmc_api |
| entities_mentioned |
📊 Evidence Profile
Evidence Balance
+0%
Certainty
0%
Debates
0
Incoming
0
Outgoing
0
0 supporting
0 contradicting
0 neutral
Public annotations (0)Annotate on Hypothes.is →
No public annotations yet.